python debug指南

一.python gdb
references:
- https://www.podoliaka.org/2016/04/10/debugging-cpython-gdb/
- https://geronimo-bergk.medium.com/use-gdb-to-debug-running-python-processes-a961dc74ae36
- https://wiki.python.org/moin/DebuggingWithGdb
- https://wiki.debian.org/HowToGetABacktrace
- https://wiki.debian.org/Debuginfod
1. 安装python gdb扩展
# gdb >= 7
#debian系,通常会除了下载cpython binary python-dbg还有下载debugging symbols
apt install python3-dbg
#fedora系:centos,rhel可能会将debugging symbols从packges中移除,需要手动下载
yum install python-debuginfo
debuginfo-install python
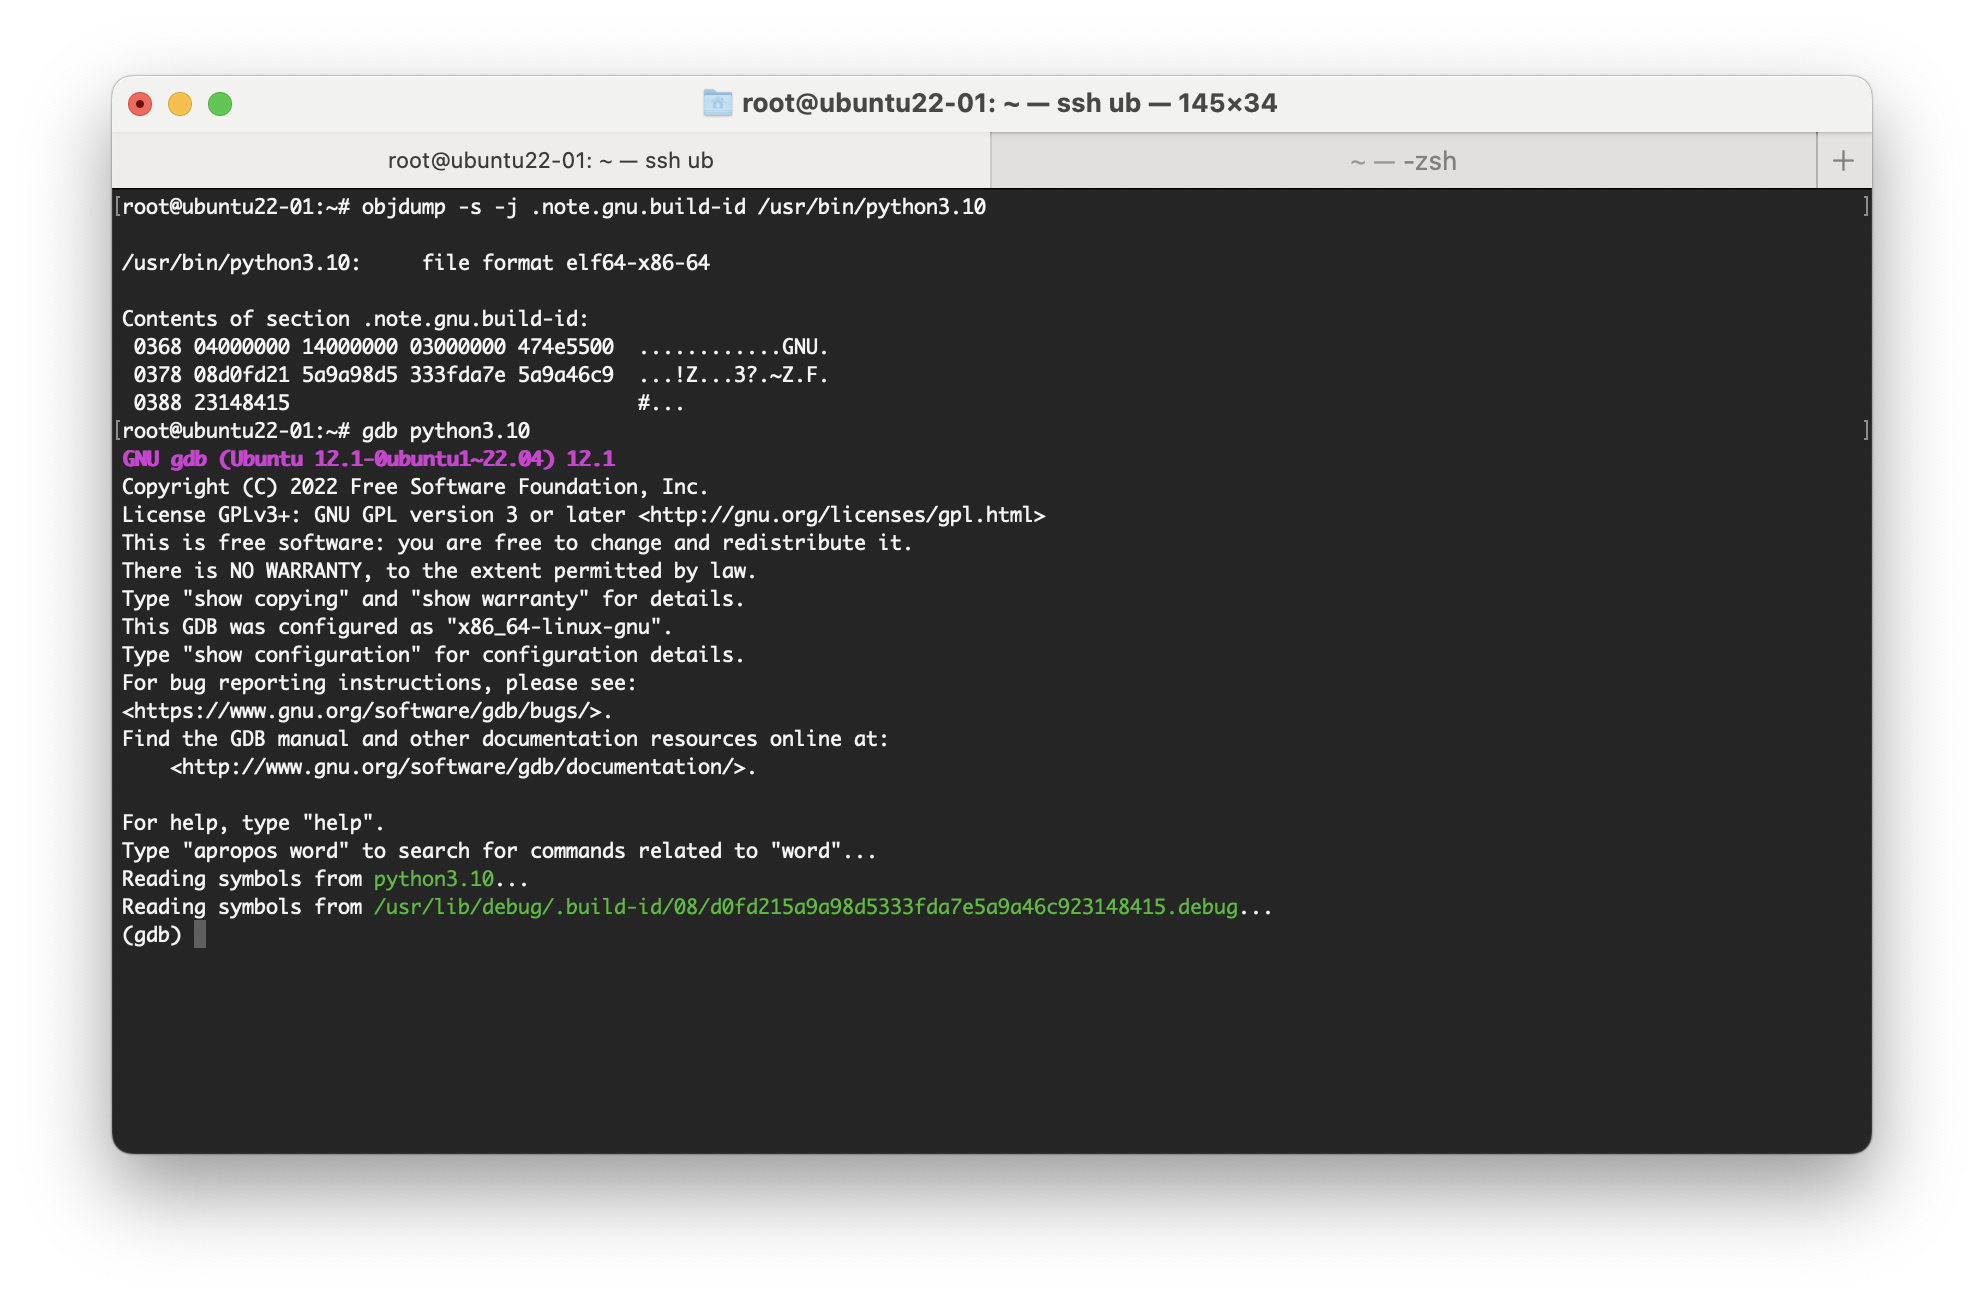
可执行文件header中含有对应的debug symbol的id,gdb -p pid出现no debugging symbols found时可能是使用virtual environment工具如conda之类导致,因为默认gdb会加载pid在/proc/pid/exe指定的可执行文件,如果使用conda的而且可执行文件是非标准路径python的话,gdb从默认路径无法找到debug symbol,解决方法是指定标准路径上的相同版本的可执行文件
gdb /usr/local/python -p pid
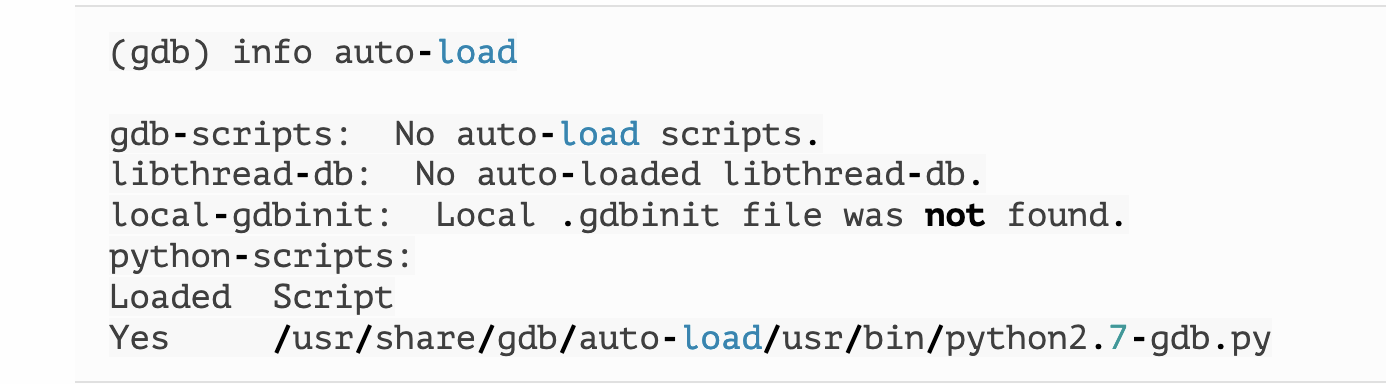
如果py-bt还是未定义,可能是当前是虚拟环境或者个人其他配置导致部分object文件gdb找不到

默认情况下,gdb将尝试为调试中的特定对象文件自动加载Python扩展(如果存在)。具体来说,gdb将查找objfile-gdb.py,并尝试在启动时获取它的源代码:

2.gdb调试的几种常见方式
-
run python under gdb from the start
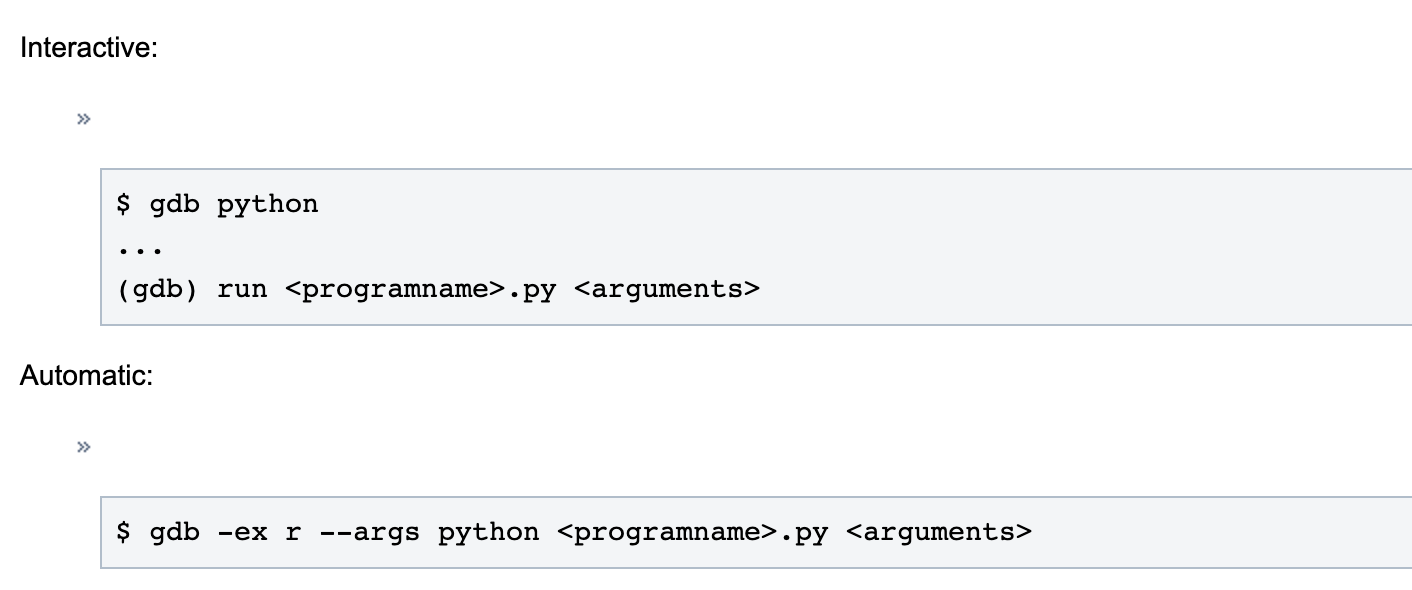
-
attach to running python process
#注意这里的第一个参数为可执行文件名,环境上多个python的需要正确指定
#ll /proc/<pid>/exe
gdb python <pid of running process>
gdb attach <pid of running process>
- debug from coredump file
配置coredump文件生成路径
# /etc/security/limits.conf
ulimit -c unlimited
# %s signal number
echo "/home/core/core-%h-%e-%s-%p-%i-%t" >  /proc/sys/kernel/core_pattern
#这里的executable file推荐使用系统路径的相同版本的python
gdb <executable file> coredump_file
3.gdb python查看相关堆栈信息
py-bt
py-list
py-locals
#多线程
info inferiros #查看当前进程
thread #查看当前线程id
info threads
thread <tid> #切换指定线程
thread apply all py-list
thread apply all py-bt
import gdb

def main():
    # 获取core文件的路径
    core_file = input("请输入core文件的路径:")

    # 启动gdb
    gdb.init(core_file)

    # 获取所有线程的id
    threads = gdb.get_threads()

    # 循环遍历每个线程
    for thread in threads:
        # 获取线程的堆栈信息
        bt = thread.get_backtrace()

        # 打印线程的堆栈信息
        print("线程id:", thread.id())
        for frame in bt:
            print(frame.function(), frame.args())

if __name__ == "__main__":
    main()
二. pdb
https://blog.csdn.net/wangyiyan315/article/details/122629255
https://docs.python.org/3/library/pdb.html
https://github.com/syl20bnr/config/blob/master/.pdbrc
https://www.codementor.io/@stevek/advanced-python-debugging-with-pdb-g56gvmpfa
pdb不仅可以调试代码,也可以方便查看调用链,比如你想知道具体一个函数是从入口脚本怎么调用到这里的,可以直接在对应的代码片段加上pdb.set_trace,之后运行,达到pdb交互模式直接敲击w回车会直接显示当前调用栈
import pdb
pdb.set_trace()

# just print
import traceback
traceback.print_stack()
list
l
# show where current line is in the code snippet
l .
# show specific range code snippet
l 32,48
# List all source code for the current function or frame.
ll
设置next或者step的时候打印当前函数上下文代码
alias n n;;ll
alias s s;;l

alias lo locals()
alias gl globals()
p variable

# pretty print using pprint
pp variable
locals()  # 获取当前上下文的局部变量
globals()
breakpoint
注意conditional break指定的条件使用的变量需要在break的上下文可见,比如break在一个局部作用域中,使用一个当前局部变量,即使外层不可见也是ok的
# show all breaks info
break
# unconditional break
break 10
# add condition to break with id 1
condition 1, ret is false
# pause when `my_var is None` is true
break your_script.py:4, my_var is None
break 4, not ret

# add commands when breakpoint is hit
commands 1
p variable_a
p variable_b
end

# remove all breakpoints
clear
# remove breakpoint with number 1
clear 1
segement fault
https://stackoverflow.com/questions/16731115/how-to-debug-a-python-segmentation-fault
https://blog.csdn.net/ARPOSPF/article/details/130248065